
Challenges and Target User
As an organization, Trase’s goals include:
- Increasing transparency for a deforestation-free economy,
- Encouraging governments, companies and others to better understand their environmental impacts, and
- Addressing and resolving the environmental impacts linked to supply chains.
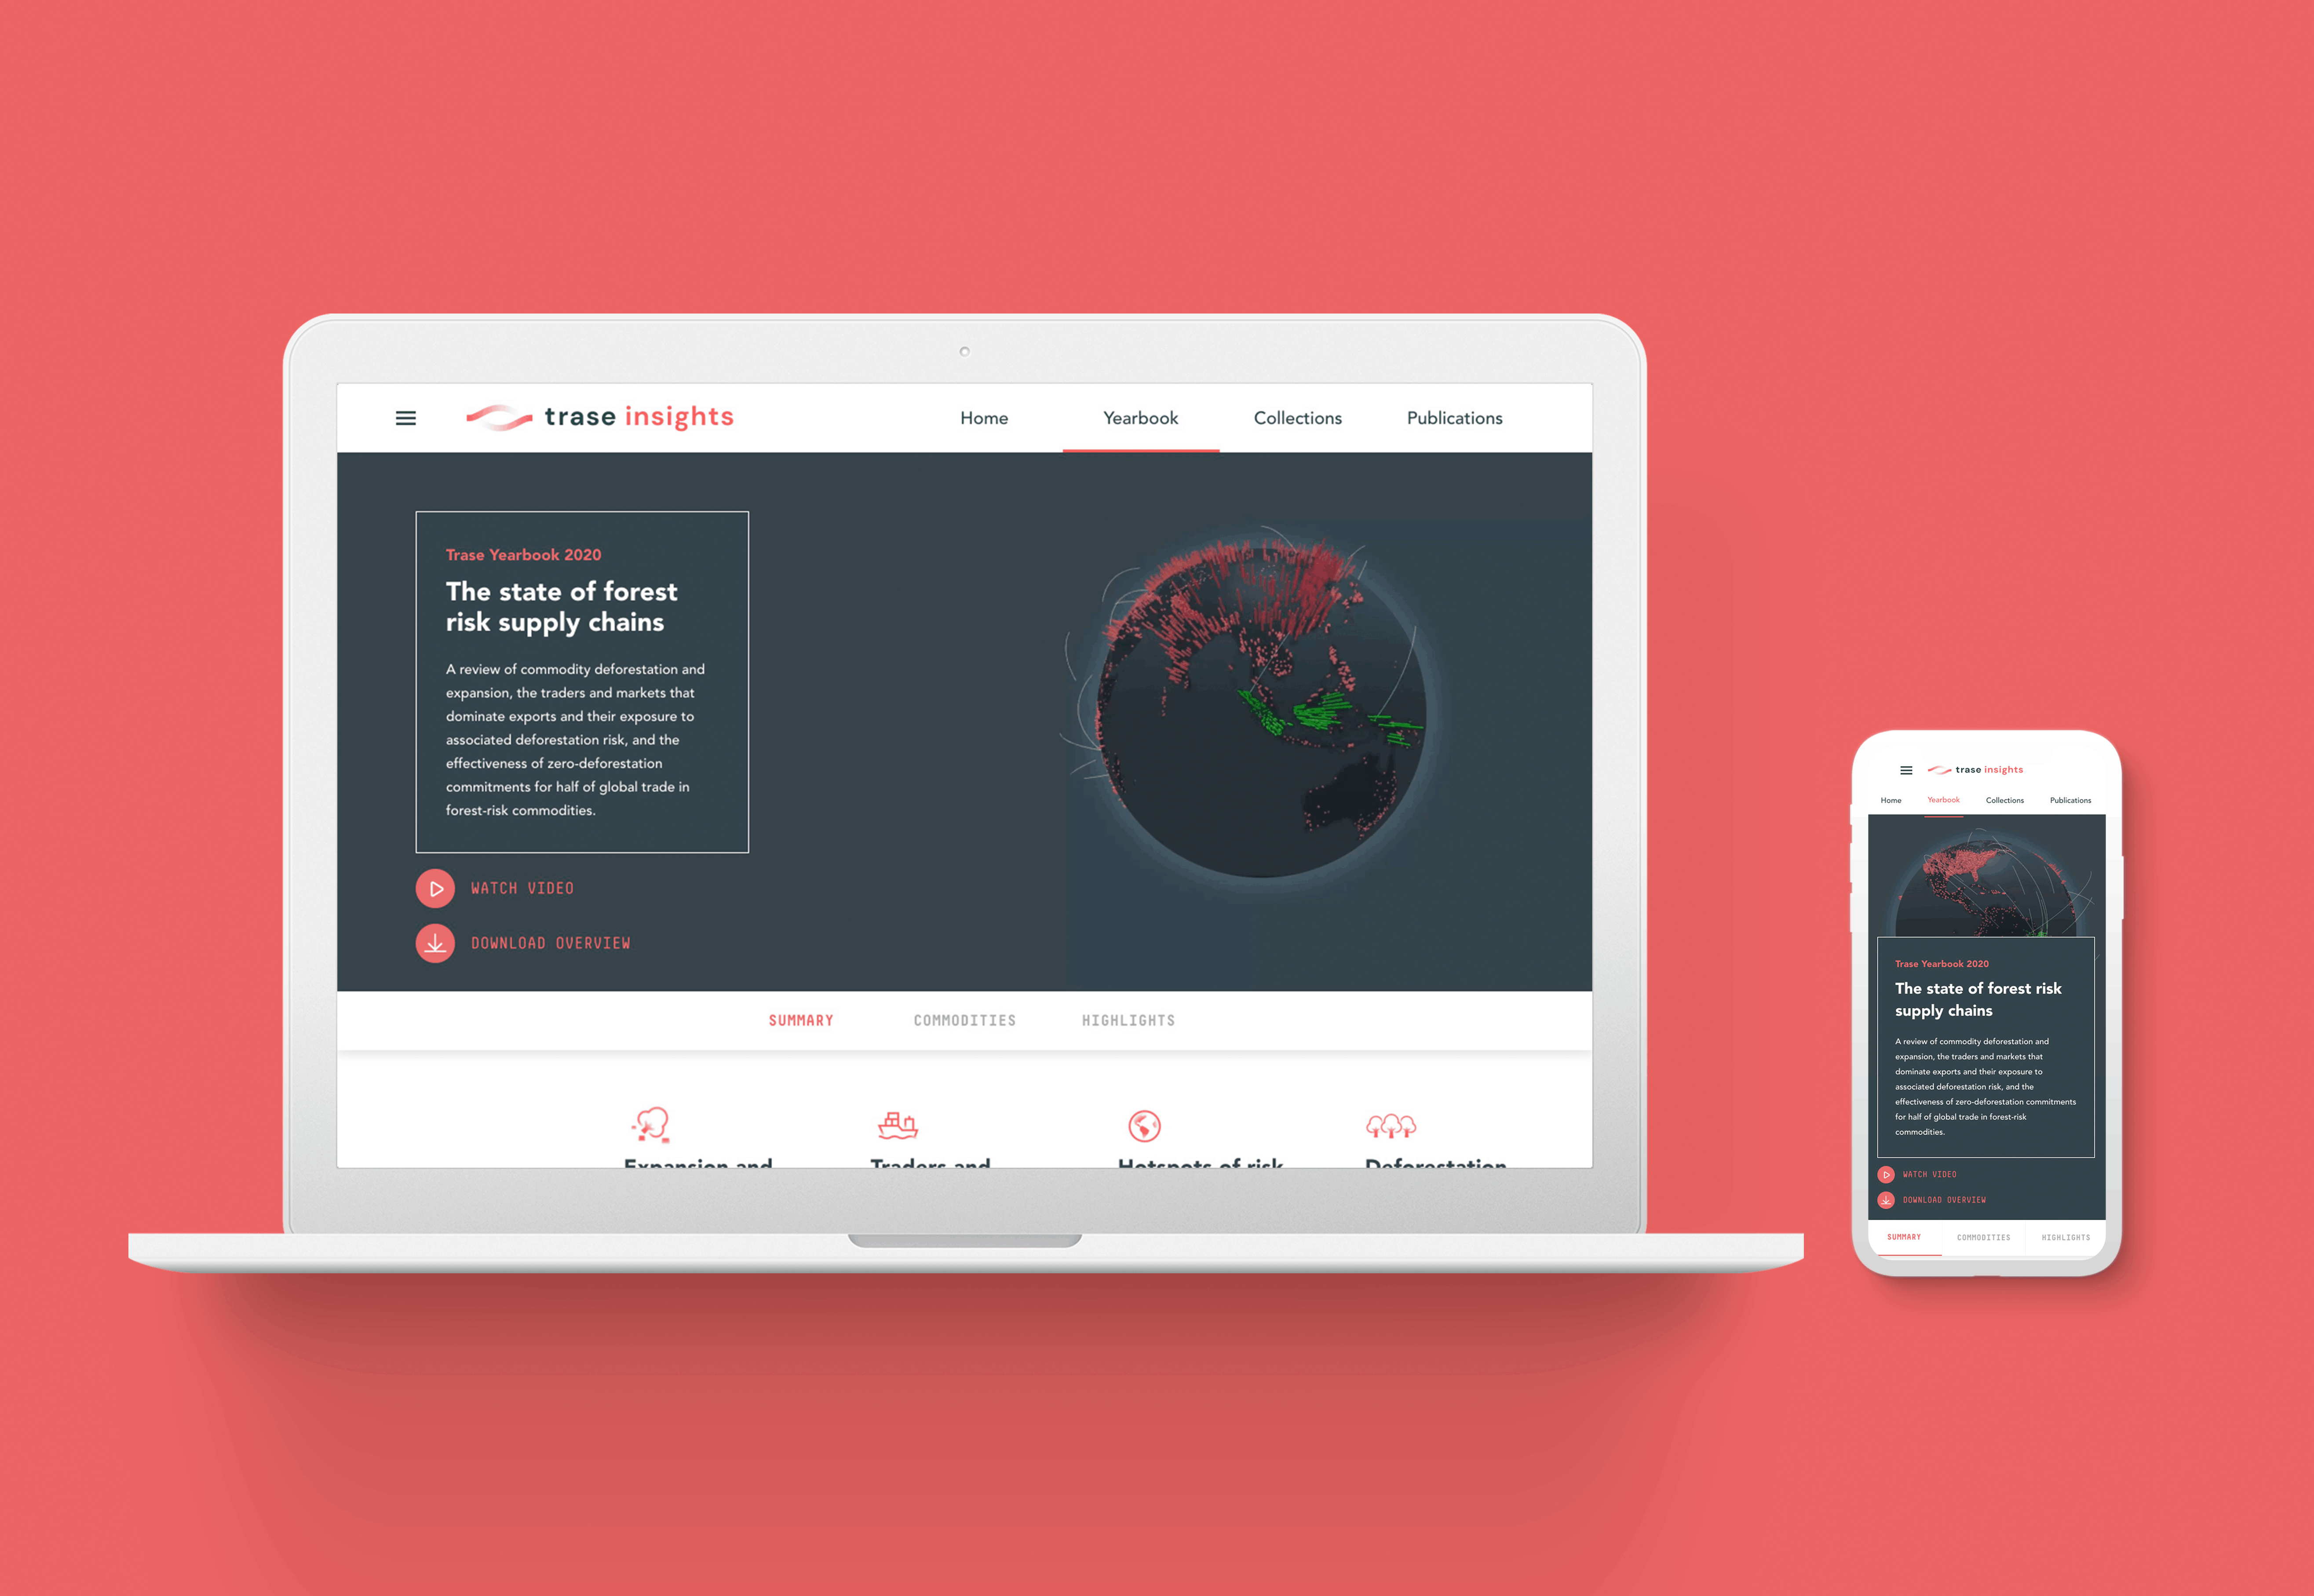
For this project, the Yearbook audience ranged from organizations with civil and environmental responsibilities and key players in the supply chain ecosystem.
In 2019, Trase published their first Yearbook for 2018. Following this first project, Trase’s project goals for their second year microsite report included:
1. A thorough design that conveyed sensitive, resourceful, and complex data about our environment in a simple, understandable, and engaging way.
2. Present the team’s data insights and contexts through stories and synthesis and tie them to the real world.
3. Clearly communicate any nuances in the data to the audience.
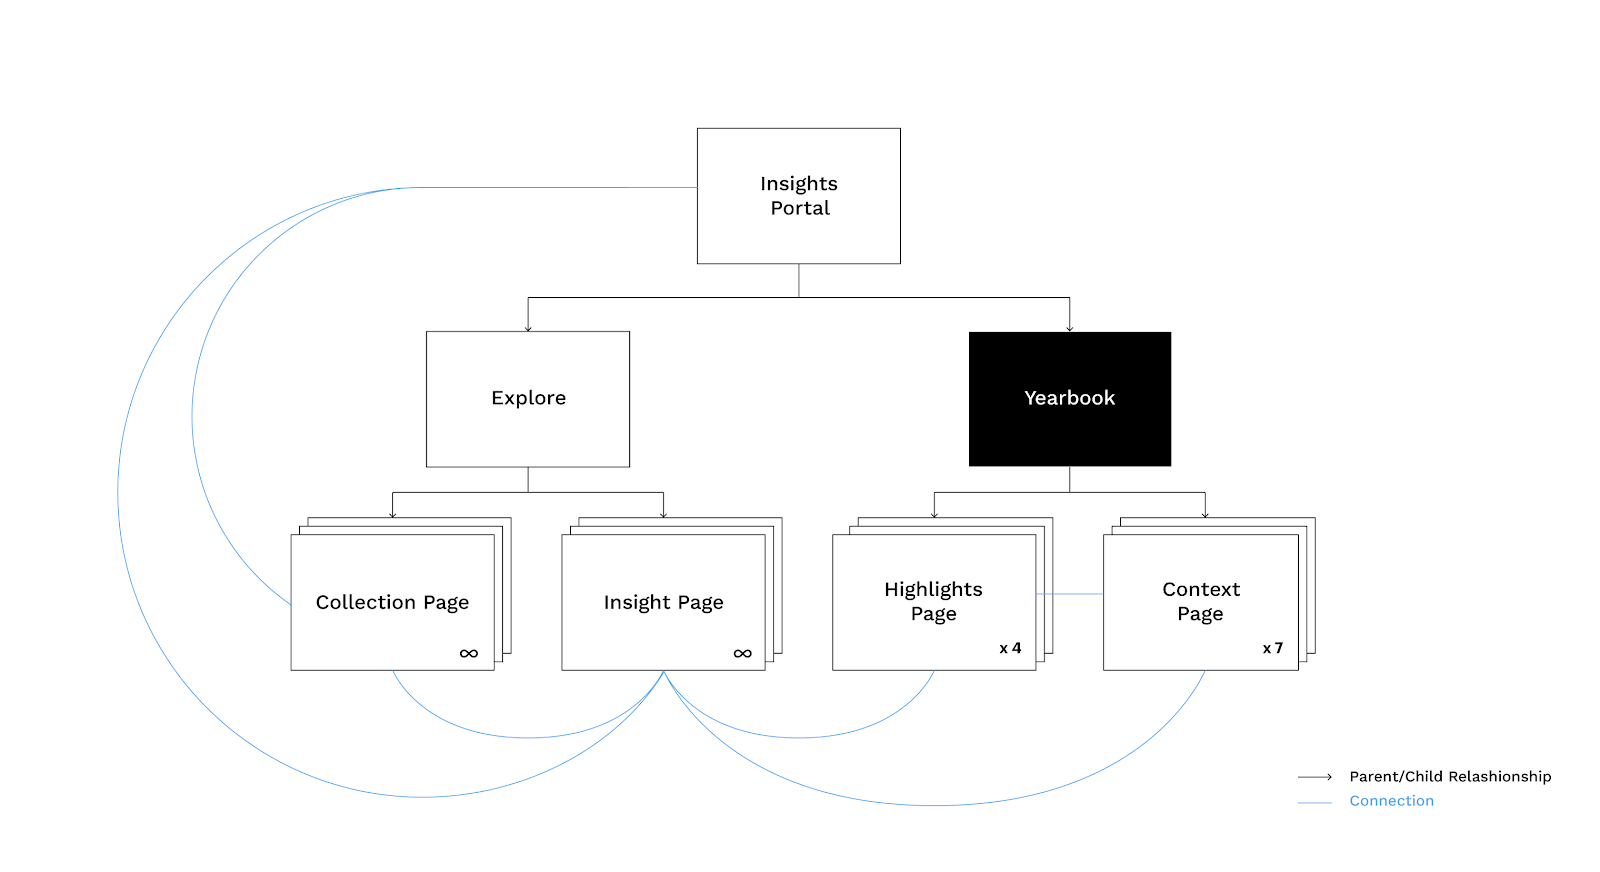
The following is a diagram highlighting the portal architecture, which helps to show the relationship between the Yearbook and Trase’s website insights.
Design Opportunities
From the design side, data visualizations are the central pieces of the Trase Yearbook. This project included the following opportunities:
1. Use Yearbook as a chance to humanize data through the Trase platform, increase the overall visibility of the platform, and showcase Trase as a unique resource with unique data for companies.
2. Communicate key facts, trends, and statistics on supply chain sustainability.
3.Create visualizations that are editable by the Trase team throughout both the design/build process as well as after launch, which is unusual for typical data visualization-focused projects.
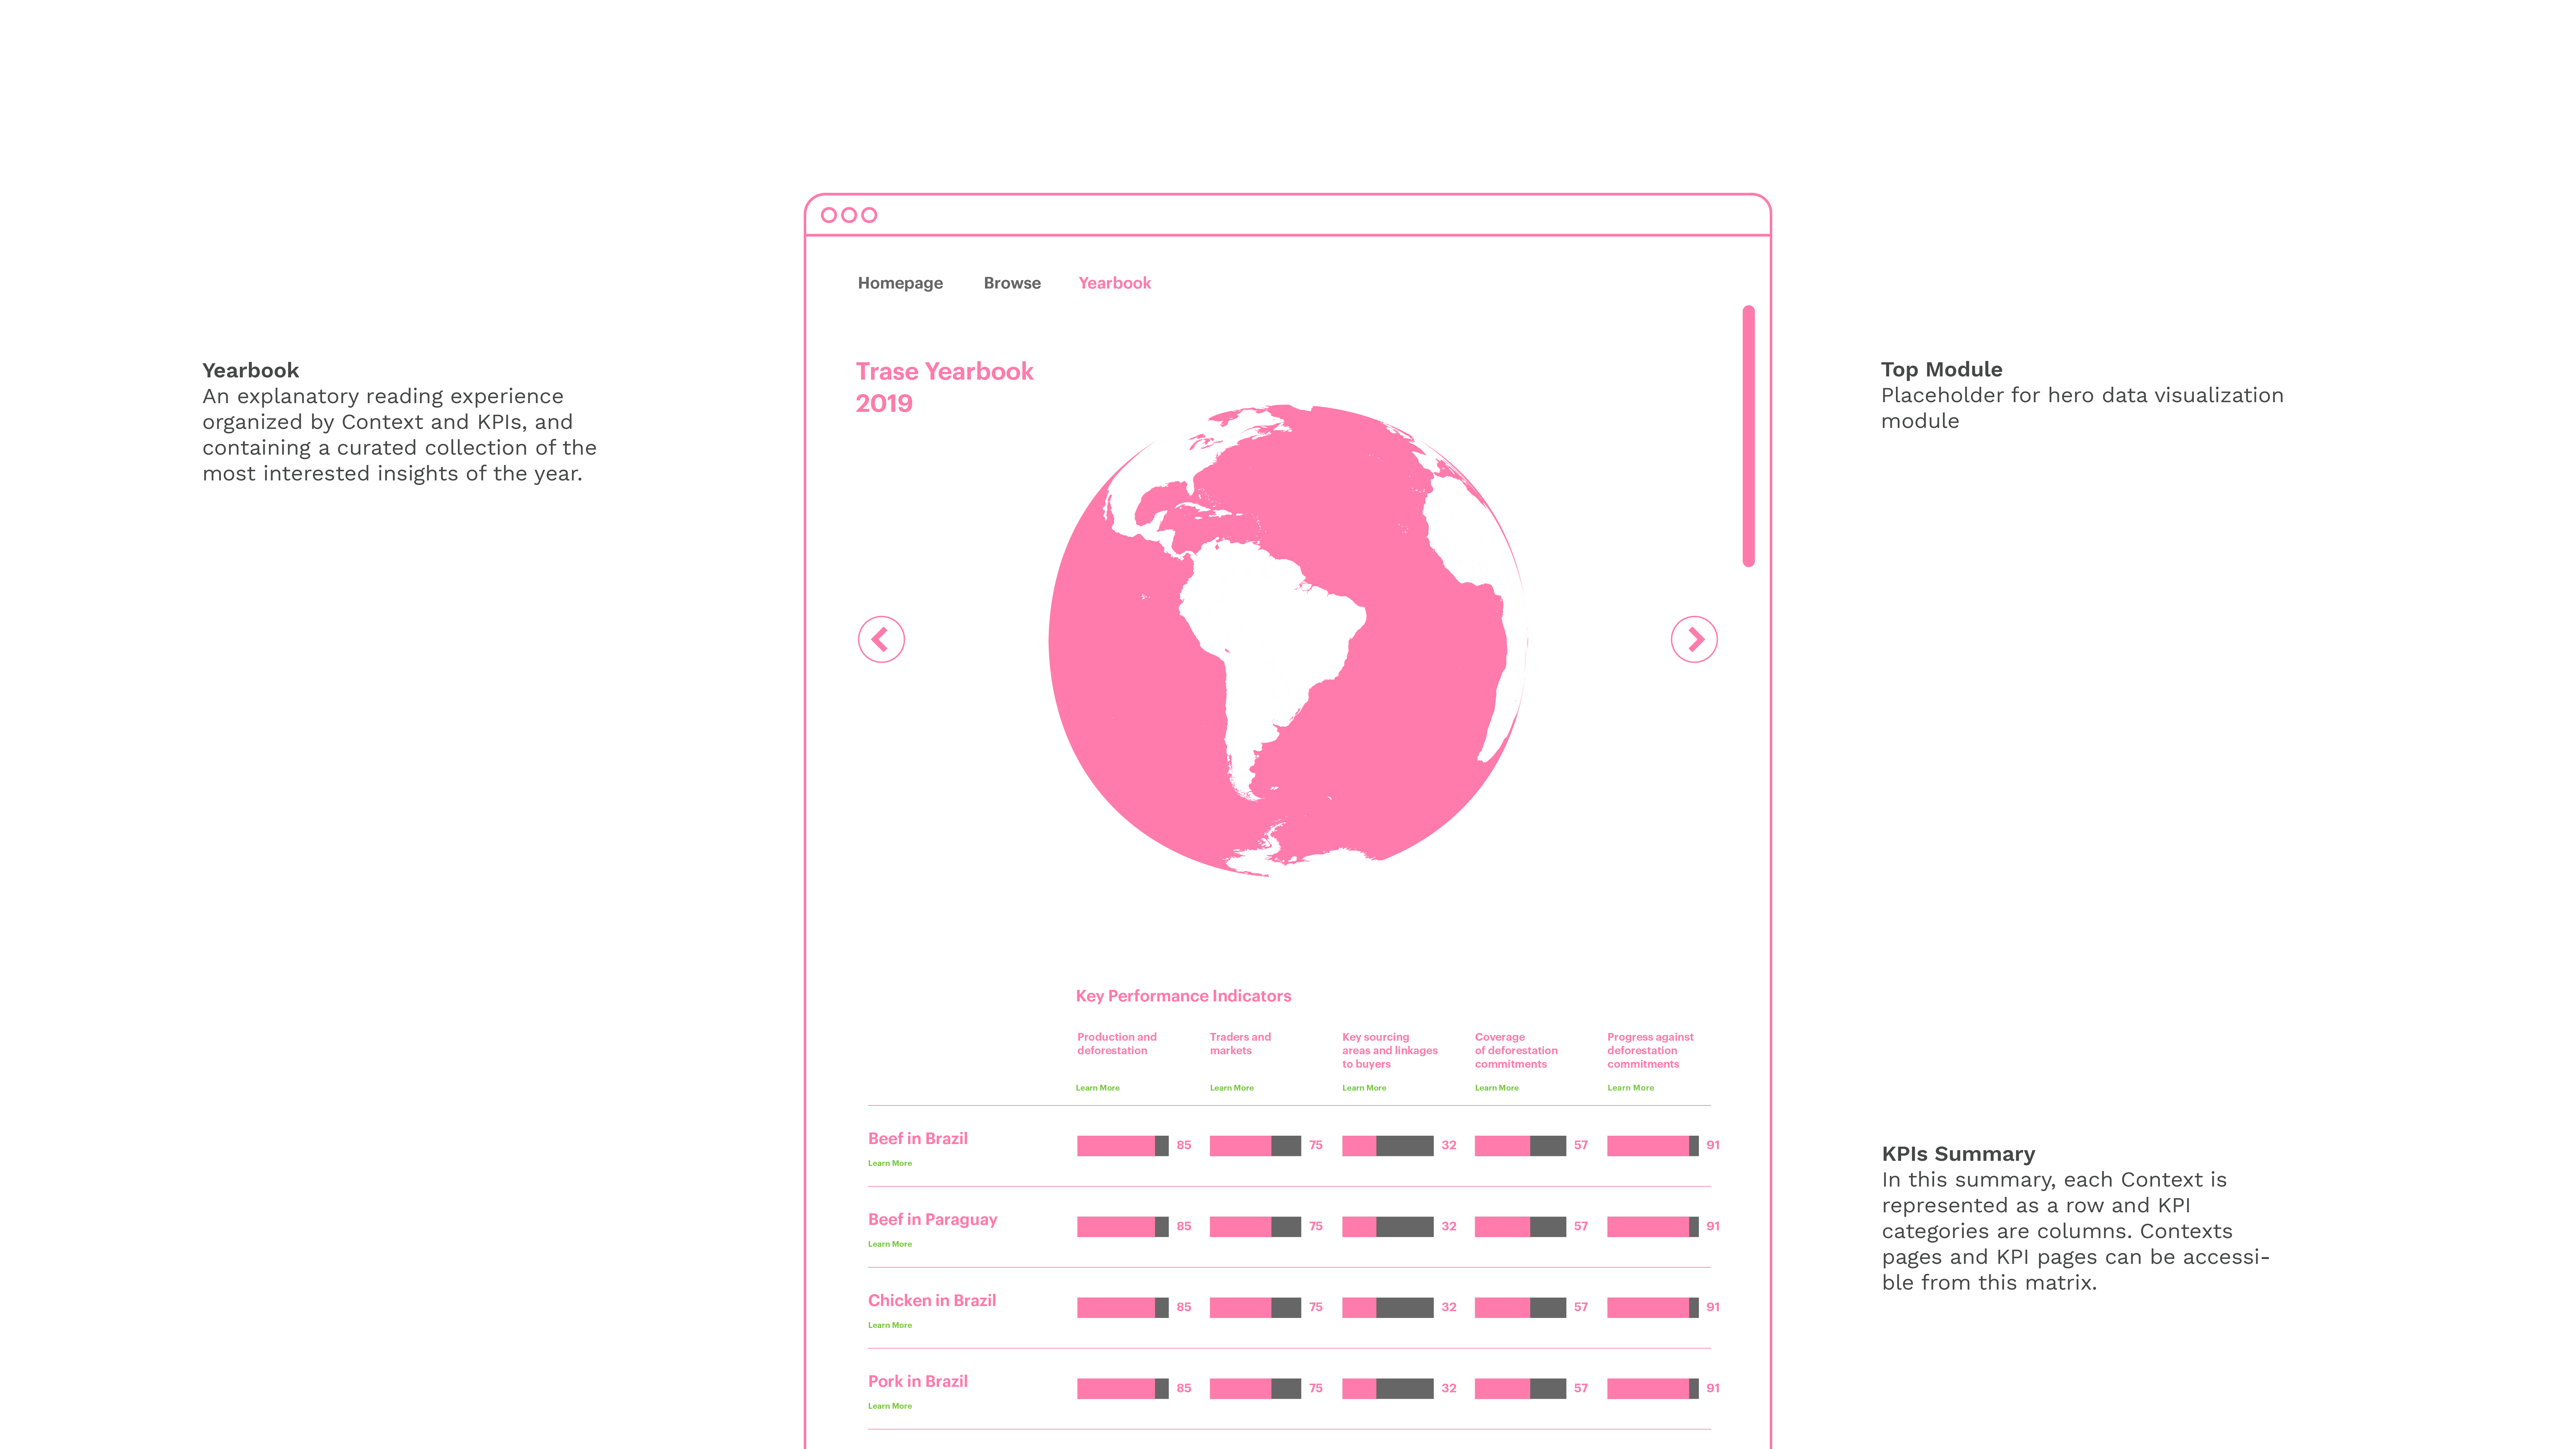
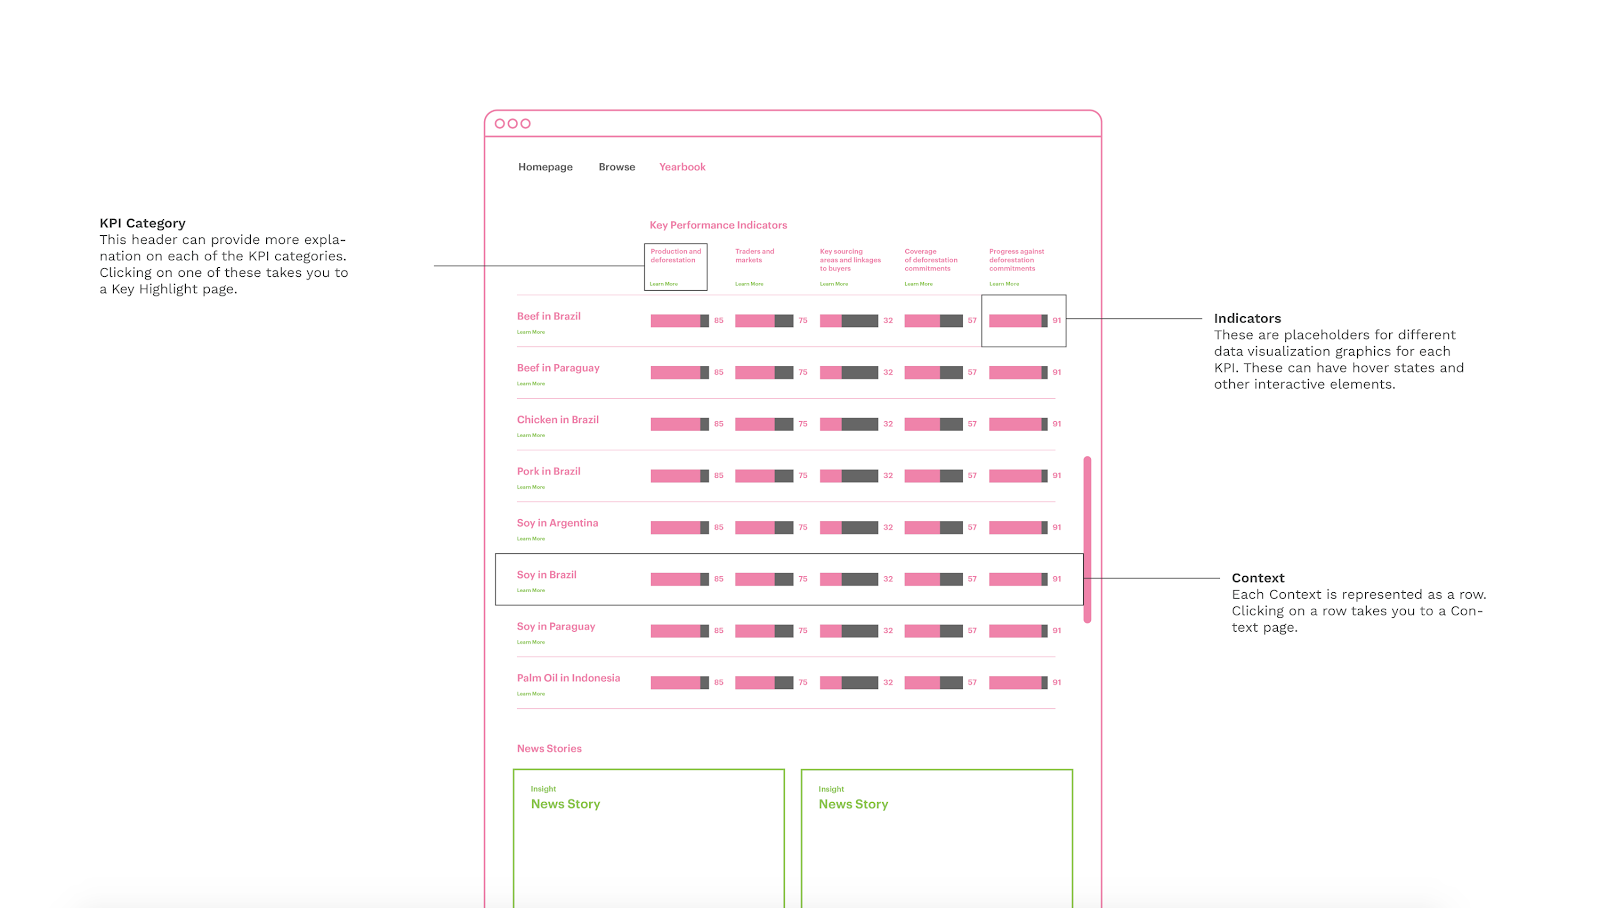
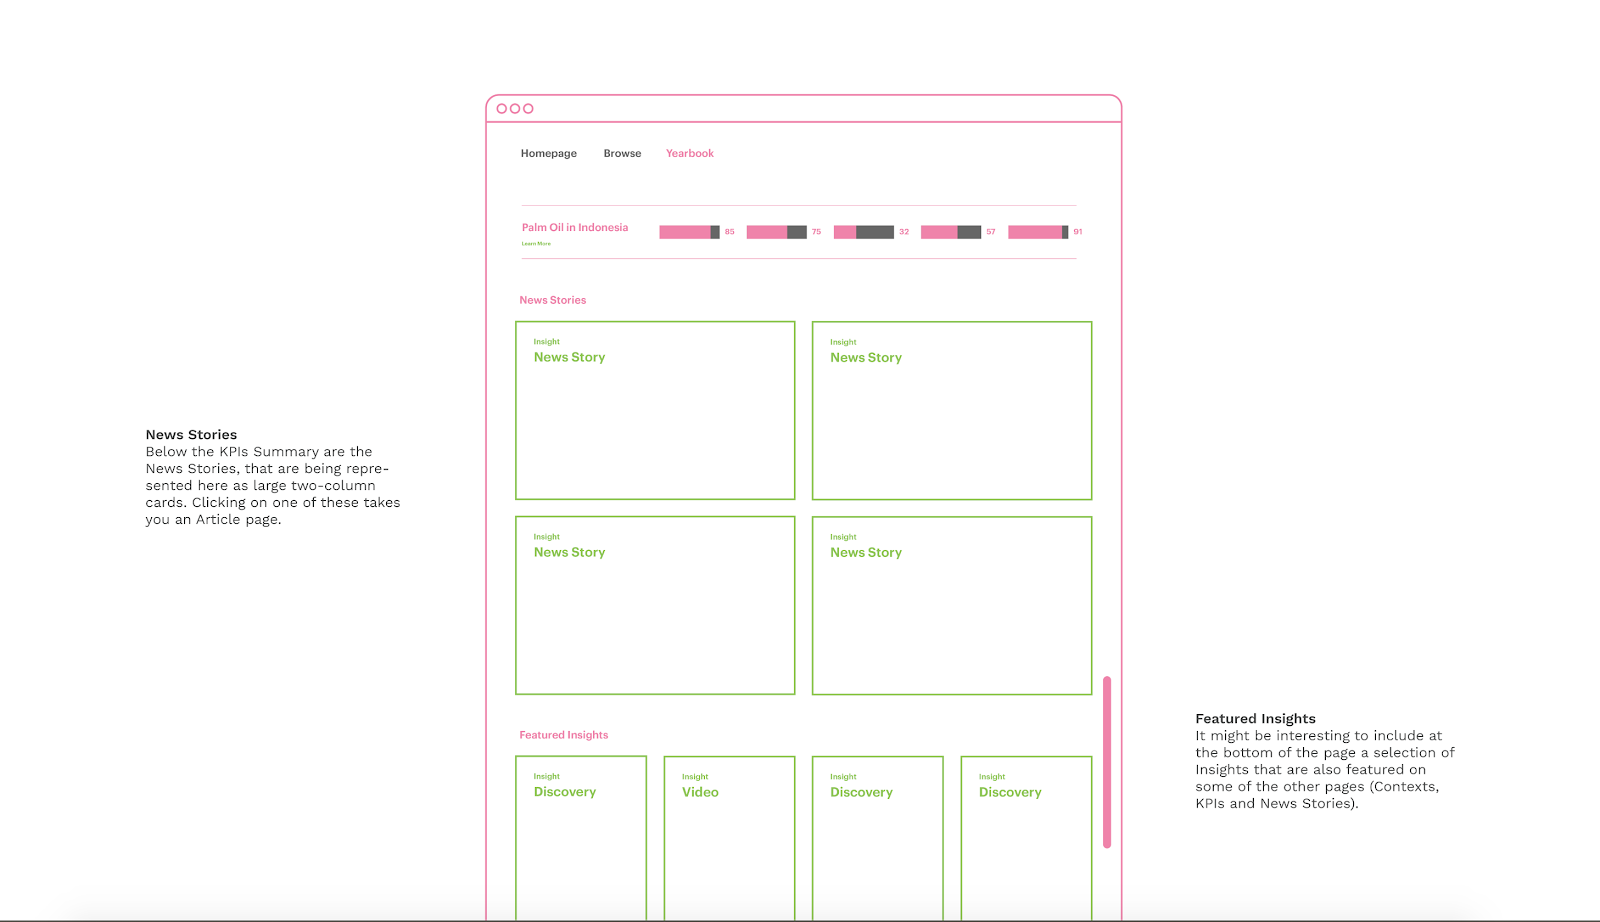
The following three graphics show the Trase Yearbook wireframes we developed in the early phases of the project.
Project Focus
Objective 1: Humanize data and increase visibility
The engineering team with Trase already had some rough ideas in mind from the start, and showed a strong interest in participating in the data visualization design process. Deforestation and supply chains are also topics that require considerable professional knowledge to interpret the massive dataset's insight. Thus, highly efficient collaboration and communication with the Trase team became key for us to brainstorm and work together. As a result, we created a series of interesting and accessible visualizations.
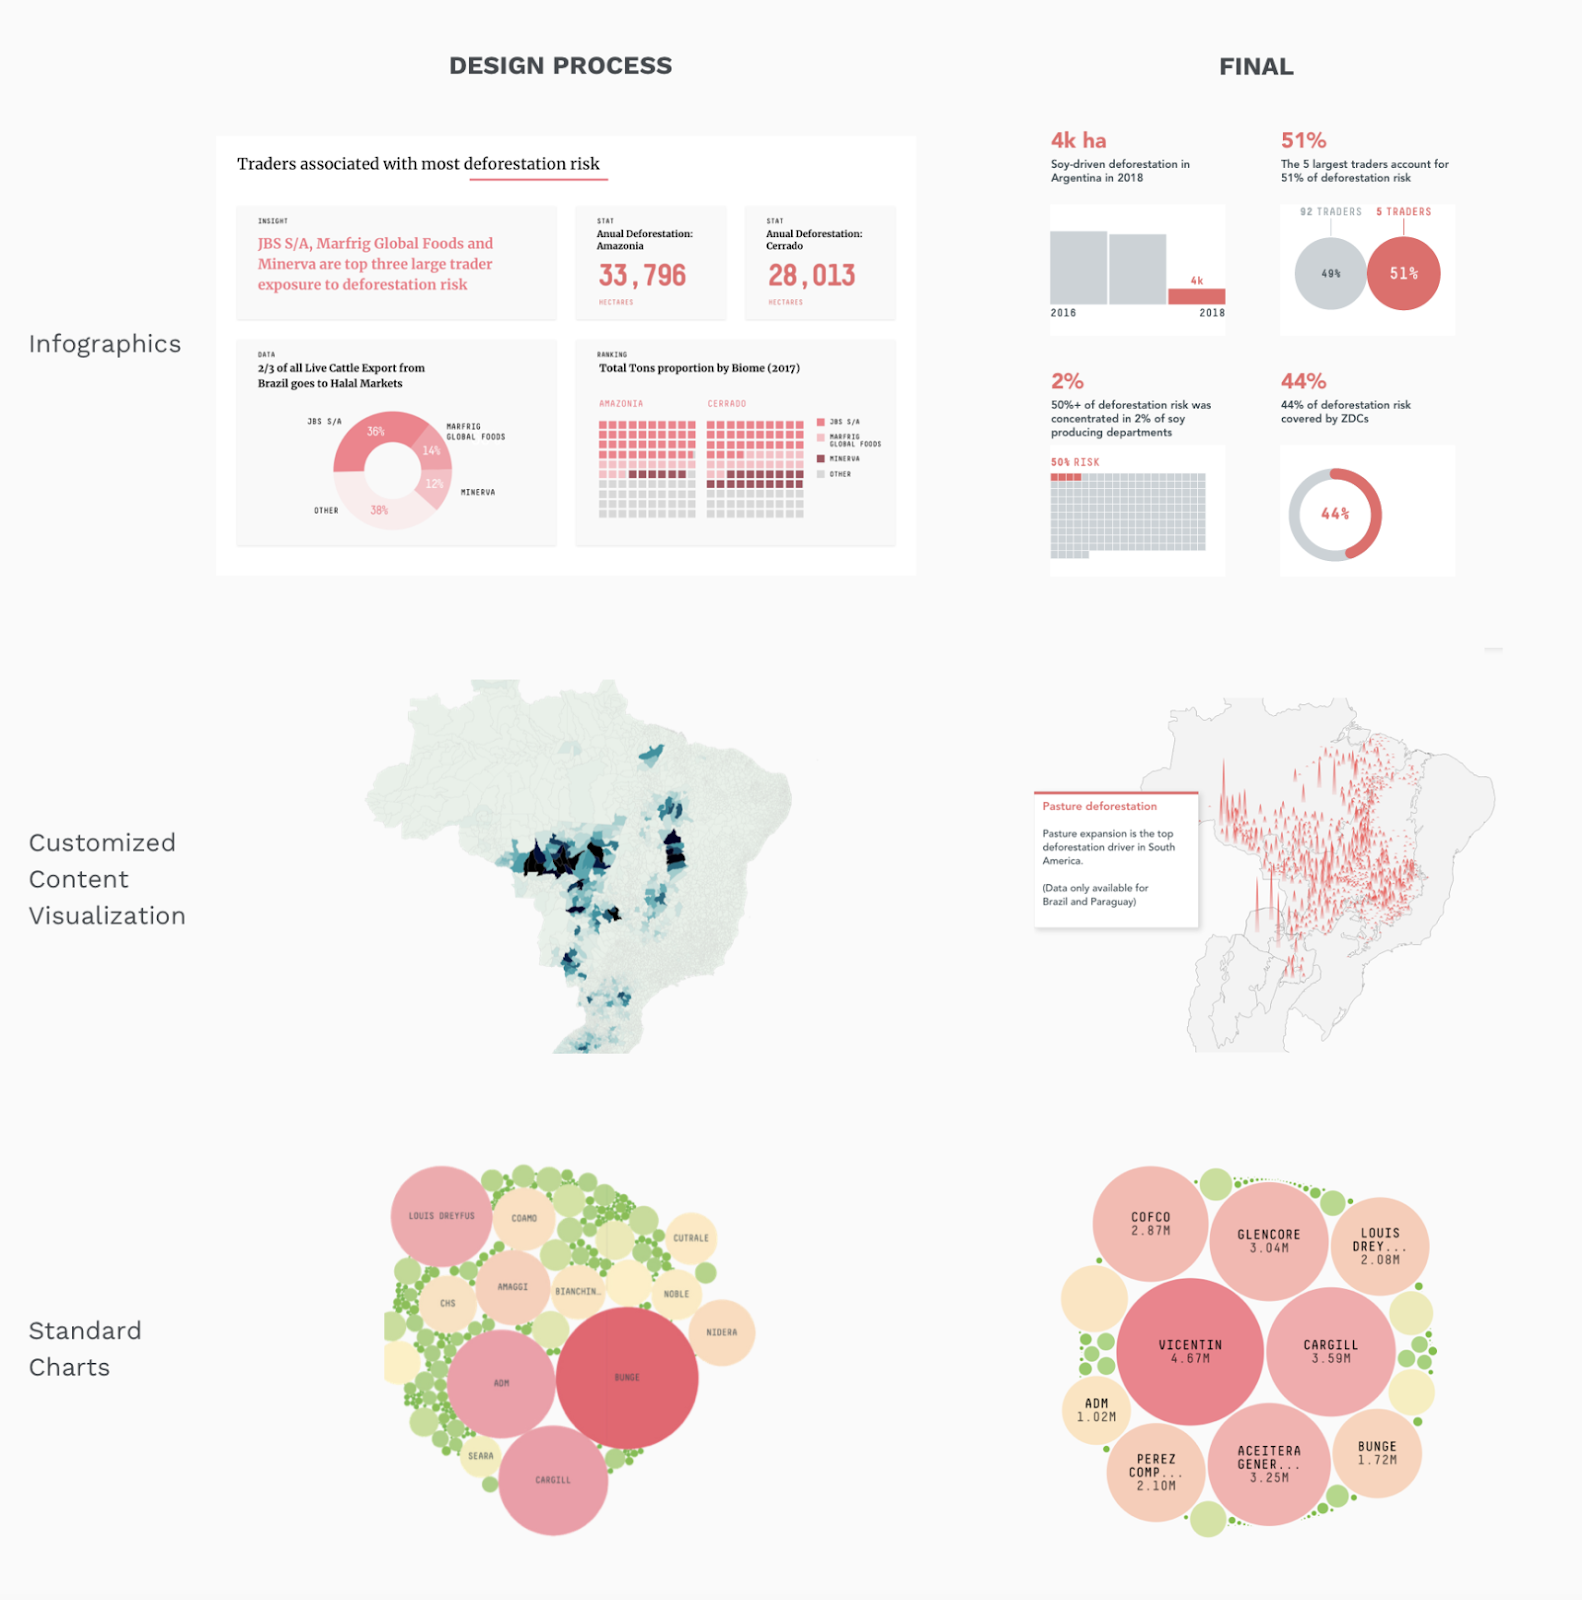
Trase wanted to highlight the findings from their unique dataset and research in order to convey the urgency of recognizing the impact of deforestation driven by global supply chains (especially those resulting from international trade).To increase visibility of the platform, we categorized the data visualizations into three types: infographics, customized content visualization templates for four key performance indicators, and standard charts. The following is a diagram highlighting each of these types of visualization and it’s design process.
Objective 2: Communicate key facts, trends, and statistics
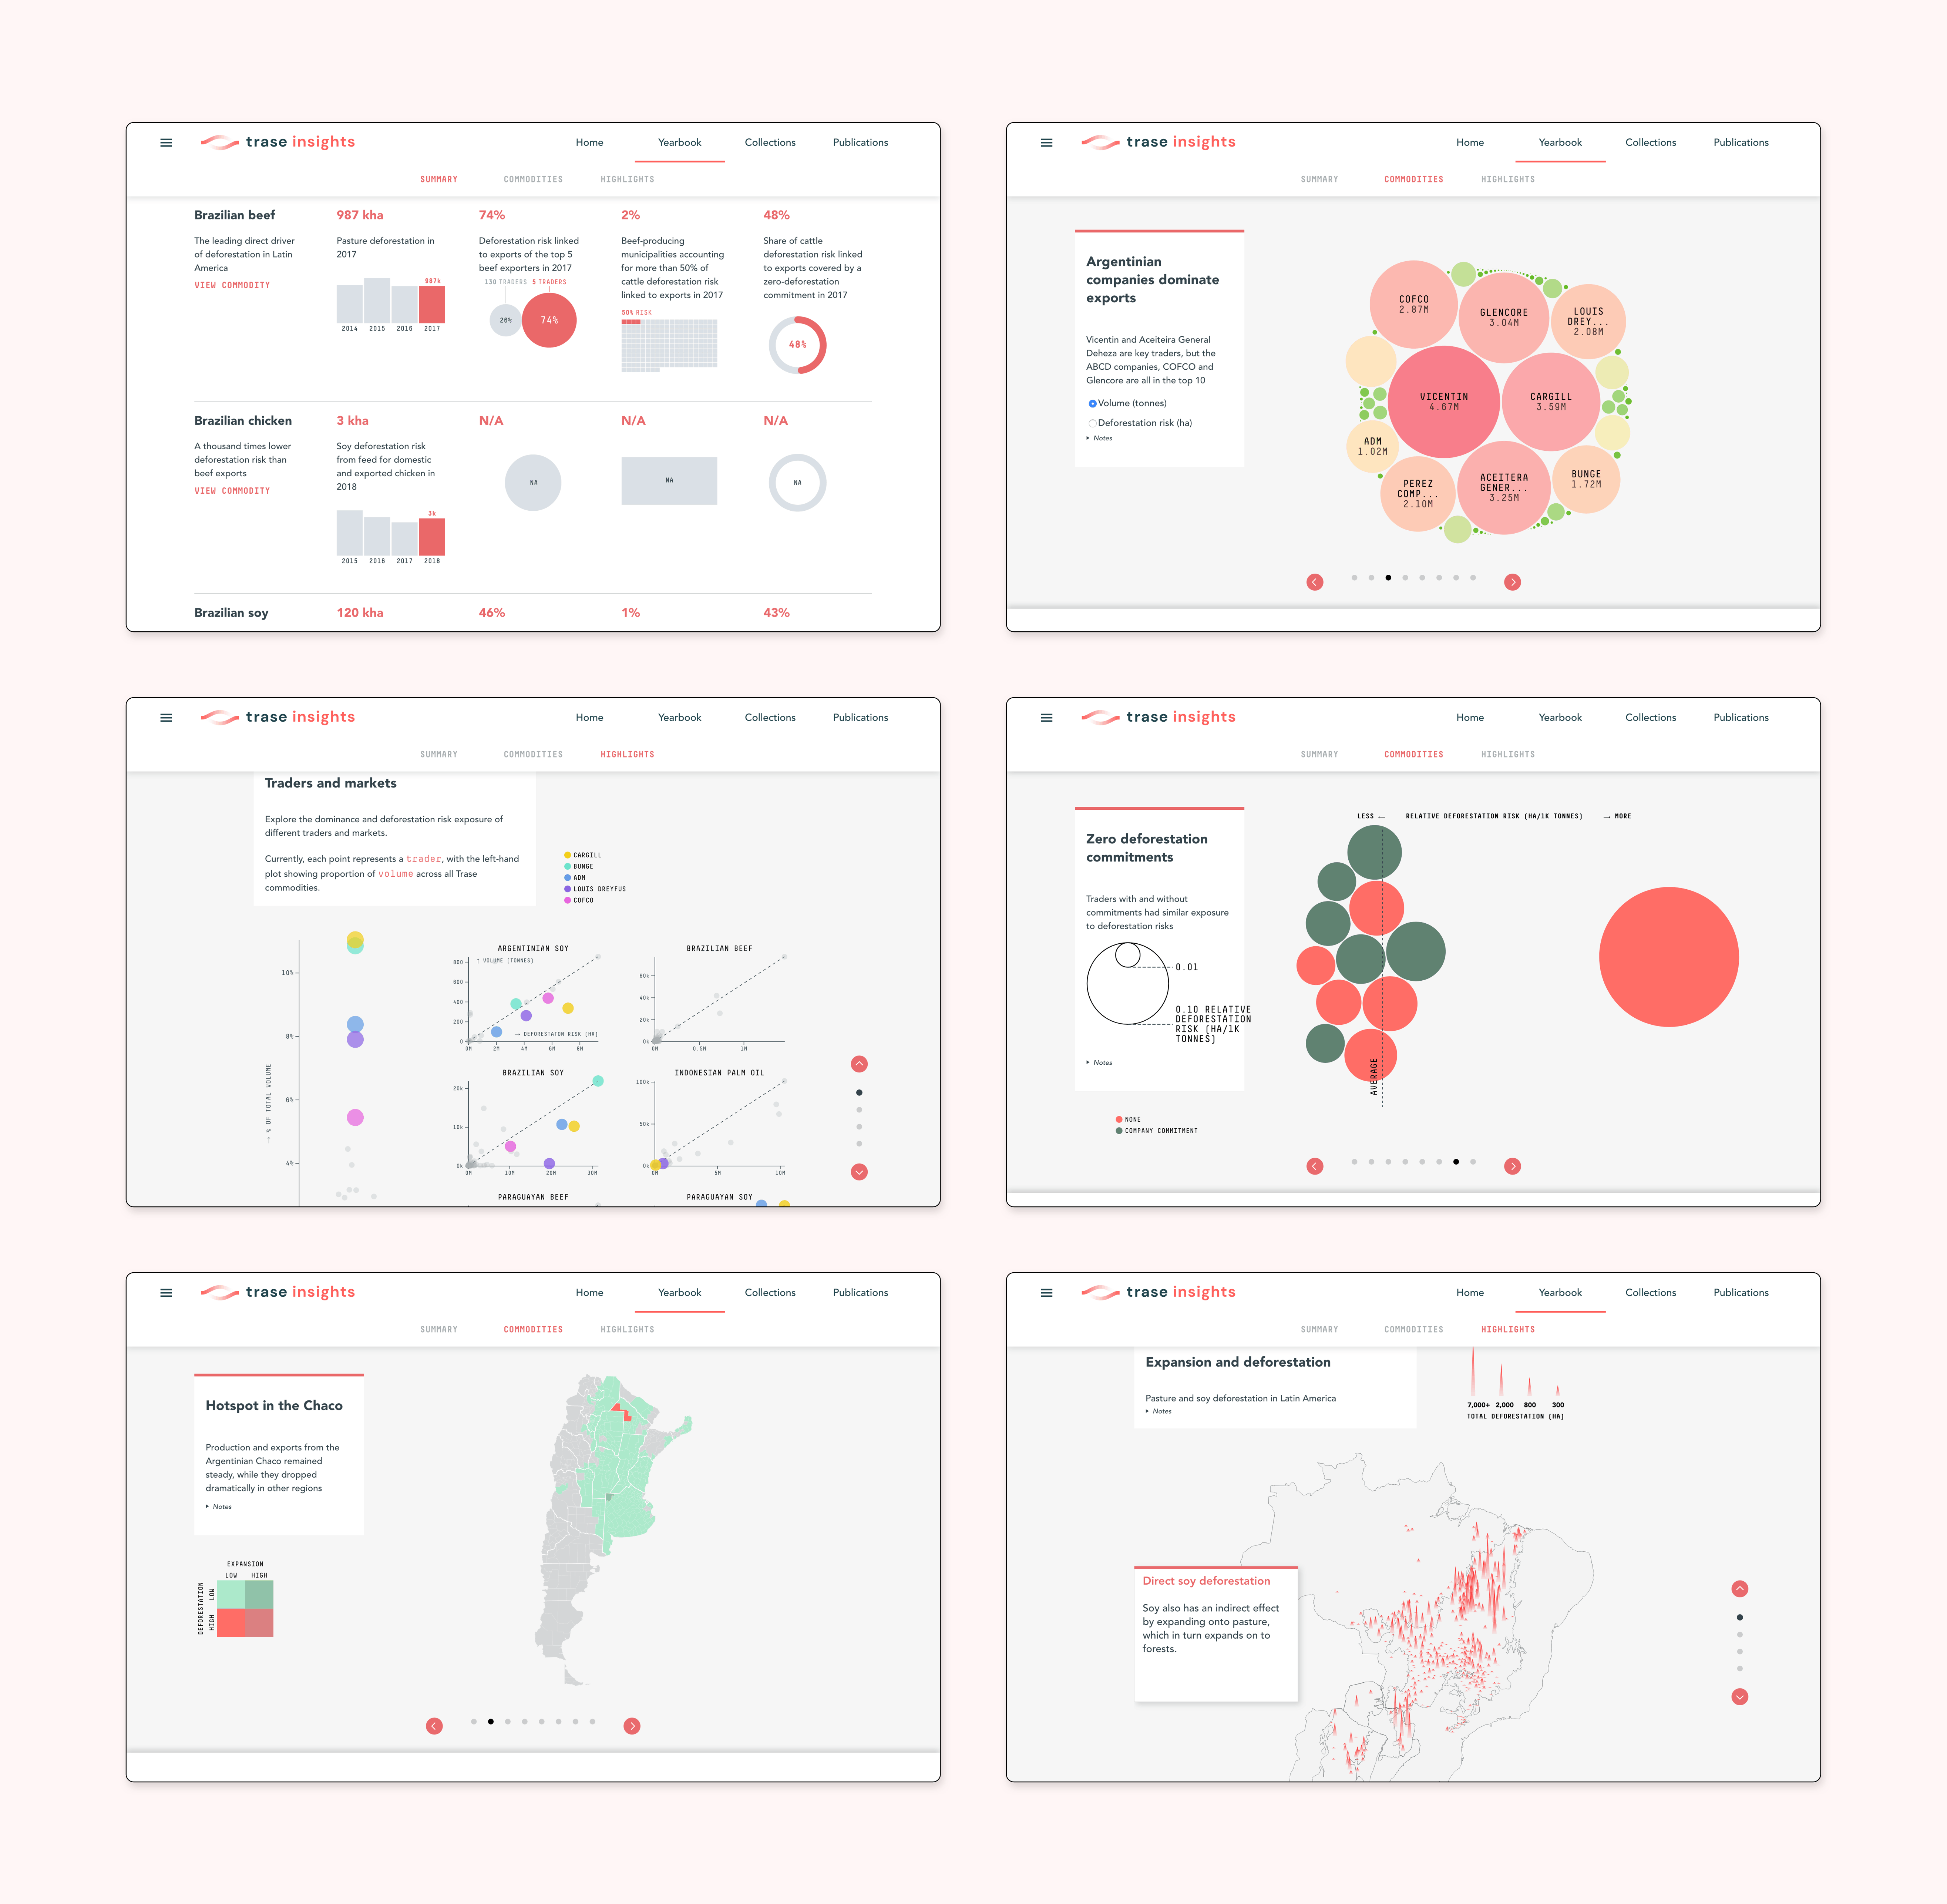
We had a four-week intense sprint to figure out the overall data visualization strategies before diving into the details. In collaboration with the Trase team, we successfully created a data visualization track for four main sections of the website that would communicate the most important information.
Each week we focused on one section, transitioning from the context page (which included key facts about each major deforestation-risks to agricultural commodities) to the highlights page (a summary of the big picture for each key performance indicator question), the new stories page which included articles based on Trase’s data (as well as other resources) in a more journalistic style, and the homepage (an explanation of what the Yearbook is and what content it contains). After the co-design process, we dove into a more detailed design and coding collaboration in Observable (an interactive code notebook) to comment and co-edit styles and content in code.
Objective 3: Make all visualizations editable
In order to make all visualizations editable for Trase, we approached this from two different directions.
First, the engineering team built the site on top of a new CMS tool developed at Schema (Schema CMS). Through internal collaboration with the engineering team, we designed and built a custom module within the CMS to link the visualizations made in Observable to the other parts of the site’s content.
The second direction was to use Observable to co-create visualizations with the Trase team and handoff work to them. I adjusted the chart’s visual styles and design tooltips by using JavaScript and CSS. The video below shows one chart I redesigned in collaboration with design technologists.
Potential Design Validation
This microsite is a media platform aimed to engage and inspire more people and corporations who aren’t familiar with the impacts of deforestation in connection to global supply chains. For future program improvements, we can make design adjustments and verifications by using Google analytics to compare page views and time spent on pages. We can then do a further analysis of the content details and the visual representation on the pages to draw more attention to them and translate those findings into design implementations that can be applied to other pages as well.
Project Impact
The launch of the 2020 Yearbook makes Trase’s data more accessible to a wider audience than ever before. Data visualization has helped facilitate this process by combining compelling interactive visualizations, key statistics, and clear analytical summaries together to translate data into workable and valuable insight.